
pmu tools is a collection of tools for profile collection and performance
analysis on Intel CPUs on top of Linux perf. This uses performance counters in the CPU.
Recent new features:
- toplev now supports --per-core / --per-socket output in SMT mode, and also a --global mode.
This also works with reprocessed data (from --perf-output / --import), so it is possible
to slice a single collection. It is also possible to specify them at the same time
to get separate summaries. With --split-output -o file the different aggregations
are written to different files. - toplev update to Ahmad Yasin's/Anton Hanna's TMA 3.6:
- {Load, Store}STLB(Hit, Miss): new metrics that breakdown DTLB_{Load, Store} costs
- L2_Evictions_(Silent, NonSilent)_PKI: L2 (silent, non silent) evictions rate per Kilo instructios
- IpFarBranch - Instructions per Far Branch
- Renamed 0/1/2/3m_Ports_Utilized
- DSB_Switches is now available
- Count Domain changes for multiple nodes. New threshold for IpTB ( Instructions per Taken Branches )
- Re-organized/renamed Metric Group (e.g. Frontend_Bound => Frontend)
- toplev now can run with the NMI watchdog enabled
- This may reduce the need for being root to change this setting
- It may still require kernel.perf_event_paranoid settings <1, unless
--single-thread --user is used. Some functionality like uncore
monitoring requires root or kernel.perf_event_paranoid < 0.
- toplev now supports running in KVM guests
- The guest needs to have the PMU enabled (e.g. -cpu host for qemu)
- The guest should report the same CPU type as the host (also -cpu host),
otherwise the current CPU needs to be overriden with FORCECPU=../EVENTMAP=.. - PEBS sampling, offcore response, and uncore monitoring are not supported
- toplev update to Ahmad Yasin's TMA 3.5:
- Support for Cascade Lake
- Add PMM_Bound nodes for persistent memory
- Add L3_Cache_Fill_BW, L3_Cache_Access_BW metrics
- new Ports breakdown into Alu, Store, Load
- Added L2[MH]PKI_ metrics
- Added MEM_PMM_Read/Write_Latency/BW metrics for persistent memory
- Fix IpArith formulas
- Fixed description for L1/2/3MPKI
- Mem_Read_latency changed to DRAM_Read_Latency / DRAM_Parallel_Reads
- Change break down of server subset
- toplev update to Ahmad Yasin's TMA 3.4
- Add Serializing_Operations on most parts and Average_Frequency
- More Erratas whitelisted
- Improved Branch_Misprediction metrics
- Better Port utilization analysis on Skylake
- Add Clear_Frontend_Cost metric
- Add a link to Ahmad Yasin's toplev/TopDown tutorial
- ucevent now supports the Skylake Server uncore.
- toplev update to Ahmad Yasin's TMA 3.31:
- Full support for Skylake Server
- Add L1/L2/L3 MKPI (Miss Per Kilo Instruction) metrics
- Full floating point FLOPS support on Broadwell+, and support for AVX512 on Skylake
- Mark estimated and measured domains
- Improve BAClear_Cost metric
- Tuned Core_Bound and Memory_Bound thresholds
- Remove some metrics to reduce multiplexing
- Report AVX frequency limitations
- toplev can now import pre-recorded perf stat output with --import, and also output perf stat output
with --perf-output - toplev and ocperf can override /proc/cpuinfo with the CPUINFO variable
- ocperf now supports experimental event lists. They can be enabled using a new
--experimental flag. - toplev now supports Xeon Scalable Server (Skylake Server)
- So far no support for uncore events
- toplev now supports metric groups (--metric-groups) and (--list-metric-groups) to configure
the metrics to measure in a fine grained way. - toplev has a new Silvermont and Knights Landing model. The Silvermont model now requires
multiplexing for L1, but can distinguish BadSpeculation and Backend Bound. There are additional metrics. - ocperf now supports wildcards for the EVENTMAP/EVENTMAP2/UNCORE/OFFCORE variables.
- toplev now always marks critical bottlenecks in default output. Removed the --bottleneck argument
- toplev updated to Ahmad Yasin's TMAM 3.2:
- Support for grouping output by related metrics
- New metrics for instruction mixes
- Breakdown of Branch_Resteers into different kinds
- New Branch_MispredictionCost metric
- Support L1/L2 cache fill bandwidth
- Revert ITLB_Misses change in 3.14
- Improved Branch_Resteers, Assists, ITLB_Misses, DTLB_Load/Store metrics
- Report Instructions
- Improve tuning hints
- toplev now prints full area for Metrics
- toplev has a new --summary option to print the summary of the complete measurement session
- ucevent now supports Broadwell EP (Xeon E5/E7 v4)
- toplev updated to Ahmad Yasin's TMAM 3.1:
- This release is aimed at Skylake and Broadwell
- Support for Broadwell Server (DE and EP)
- Improved Mem Bound and Mem_Bandwidth/Latency to account for prefetches
- Fixes to Store_Latency metric to include L2_Hit Stores
- Account FB_hit in memory related metrics
- More accurate Branch_Resteers on Skylake
- Improved False Sharing / Congested Accesses
- Various other improvements
- Support for a new reduced profile with less multiplexing (enable with --redecued)
- toplev now supports --sample-basename to specify the basename of the
sample perf.data file - toplev now supports --sample-repeat to interleave measuring and sampling for
longer workloads. - toplev now supports --sample-args to pass different arguments to the sample perf.
The arguments need to be specified with + instead of - (--sample-args "+b") - toplev now automatically includes cycles with sampling
- toplev now checks for event errata and automatically disables affected nodes, unless --ignore-errata is specified.
- ucevent now supports Broadwell Xeon-D
- jevents has now limited support for Uncore events
- toplev updated to Ahmad Yasin's TopDown/TMAM 3.02:
- Tuned Memory_Bound vs Core_Bound threshold
- Vastly improved Tuning hints
- Fix Stores_Bound before Skylake
- Fix RS_Empty nodes
- Improve IFetch_Line_Utilization
- Uncore support is disabled for now
- toplev now supports columnar output in CSV mode (-x, --column)
- toplev can print the critical bottleneck with --bottleneck
- The tools can now find event lists for the original user of sudo
- jevents now has a perf stat like tool called jstat (renamed to jestat)
- jevents can now list and automatically resolve perf style events and aliases
- simple-pebs is a simple reference Linux PEBS driver
- ocperf now supports uncore events on some systems (experimental)
- libjevents now supports handling the perf ring buffer and reading performance counters from ring 3 in C programs, in addition to resolving symbolic event names. For more details see the API reference and the jevents README
- Support for Airmont and Broadwell with Iris CPUs
- toplev updates to Ahmad Yasin's TopDown 3.0 (only Haswell and up for now):
- Support for Skylake CPUs
- Experimental uncore support (needs special event files)
- L3_Bound, L3_Latency, ITLB_Misses, Memory/Core_bound accuracy improved
- Enhanced sampling for Branch_Resteers, *_Port_Utilized
- Precise sampling for frontend issues on Skylake
- A range of bug fixes
- Support for Xeon-D (Broadwell-DE micro server)
- New nodes: Assists, L3_Bandwidth
- A range of new metrics
- GFLOPS excludes x87
- Workaround for UOPS_EXECUTED issue on Haswell
- Fix TLB related nodes on BDW
- 0_Ports_Utilized excludes divider cycles
- Fix for Frontend_Latency on SMT on Haswell
- toplev has a new --nodes option to add and remove specific measurements.
- toplev has a new --columns option to print results from different CPUs side-by-side.
- toplev now has a (draft) tutorial and manual
- toplev now detects kernel counter scheduling problems based on the kernel version and automatically
disables nodes with unsupported events. Can be overridden with --force-events. - toplev now defaults to measuring the whole system even on non SMT. The old mode
can be still enabled with --single-thread. It should be only used on single threads
and when the other thread is idle on SMT. In addition there is a new --core option
to select the CPUs to measure. - toplev can now automatically sample workloads with --run-sample
- Added cputop utility to easily enable/disable hyper threading
- toplev updated to TopDown 2.9:
- Many fixes to SMT support. SMT now supported on Haswell.
- Many bug fixes to metrics
- Initial Haswell Server support
- Add a Sandy Bridge EP model
- Lots of new metrics and nodes: e.g. Core IPC, MUX confidence,
BPTB (Branch per Taken Branch), SMT_2T utilization,
IFetch_Line_utilization - Initial Broadwell model support
- Improve sample event support. Now enable them by default.
- --per-core and --per-socket support dropped with SMT
- The new tl-serve.py tool displays toplev output in a web browser.
All features:
Major tools/libraries
- The "ocperf" wrapper to "perf" that provides a full core performance
counter event list for common Intel CPUs. This allows to use all the
Intel events, not just the builtin events of perf. Can be also used
as a library from other python programs - The "toplev.py" tool to identify the micro-architectural bottleneck for a workload.
This implements the TopDown or TopDown2
methodology. - The "ucevent" tool to manage and compute uncore performance events. Uncore is the part of the CPU that is not core. Supports many metrics for power management, IO, QPI (interconnect), caches, and others. ucevent automatically generates event descriptions
for the perf uncore driver and pretty prints the output. It also supports
computing higher level metrics derived from multiple events. - A library to resolve named intel events (like INST_RETIRED.ANY)
to perf_event_attr (jevents)
jevents also supports self profiling with Linux since Linux 3.3. Self
profiling is a program monitoring its own execution, either for controlled
benchmarking or to optimize itself.
For self-profiling on older kernels you can use
simple-pmu - Support for Intel "offcore" events on older Linux systems where
the kernel perf subsystem does not support them natively.
Offcore events allow to categorize memory accesses that go outside the core. - Workarounds for some issues with offcore events on Sandy Bridge EP
(Intel Xeon E5 v1)
This is automatically enabled for the respective events with ocperf, and also
available as a standalone program or python library. - A variety of tools for plotting and post processing perf stat -I1000 -x,
or toplev.py -I1000 -x, interval measurements.
Experimental/minor tools:
- An example program for address profiling on Nehalem and later
Intel CPUs (addr) - Some utility programs to access pci space or msrs on
the command line - A utility program to program the PMU directly from user space
(pmumon.py) for counting. This is mainly useful for testing
and experimental purposes. - A program to print the currently running events (event-rmap)
- Support for analyzing the raw PEBS records with perf.
- A pandas/scipy data model for perf.data analytics (work in progress)
Help wanted
- The plotting tools could use a lot of improvements. Both tl-serve and tl-barplot.
If you're good in python or JS plotting any help improving those would be appreciated.
Usage:
Check out the repository. Run the tools from the directory you
checked out (but it does not need to be the current directory)
They automatically search for other modules and data files
in the same directory the script was located in.
You can set the PATH to include the repository to run the tools
from other directories:
export PATH=/path/to/pmu-tools:$PATH
What tool to use for what?
You want to:
- understand CPU bottlenecks on the high-level: use toplev.
- display toplev output graphically: use tl-server or toplev --graph
- know what CPU events to run, but want to use symbolic names: use ocperf.
- measure interconnect/caches/memory/power management on Xeon E5+: use ucevent
- Use perf events from a C program: use jevents
- Query CPU topology or disable HyperThreading: use cputop
- Change Model Specific Registers: use msr
- Change PCI config space: use PCI
The other tools are for more obscure usages.
Dependencies
All tools (except for parser/) should work with a python 2.7
standard installation. All need a reasonably recent perf (RHEL5 is too old)
ocperf.py should work with python 2.6, or likely 2.5 when the json
module is installed. msr.py will also work with 2.6 if
argparse is installed (it is enough to copy those files from
a python 2.7 installation)
Except for the modules in parser/ there are no special
dependencies outside a standard python install on a recent
Linux system with perf.
parser/ needs a scipy stack with pandas and pyelftools.
The perf tool should not be too old.
toplev has kernel dependencies, please see https://github.com/andikleen/pmu-tools/wiki/toplev-kernel-support
simple-pebs and pebs-grabber require a Linux kernel source tree to build.
They may not build on some older versions of Linux (patches welcome)
Tools
ocperf:
ocperf is a wrapper to "perf" that provides a full core event list for
common Intel CPUs. This allows to use all the Intel defined events,
not just the builtin events of perf.
A more detailed introduction is in Andi's blog
Ahmad Yasin's toplev/TopDown tutorial
ocperf.py list
List all the events perf and ocperf supports on the current CPU
ocperf.py stat -e eventname ...

ocperf.py record -c default -e eventname ...

ocperf.py report
When an older kernel is used with offcore events (events
that count types of memory accesses outside the CPU core)
that does not support offcore events natively, ocperf has to run
as root and only one such profiling can be active on a machine.
When "-c default" is specified for record, the default sampling overflow value will be
filled in for the sampling period. This option needs to be specified before
the events and is not supported for all CPUs. By default perf uses
a dynamic sampling period, which can cause varying (and sometimes
large) overhead. The fixed period minimizes this problem.
If you have trouble with one of the many acronyms in the event
list descriptions, the Intel optimization manual describes many of them.
ocperf API
ocperf.py can be also used as a python module to convert or list
events for the current CPU:
	import ocperf

	emap = ocperf.find_emap()
	if not emap:
		sys.exit("Unknown CPU or cannot find event table")
	ev = emap.getevent("BR_MISP_EXEC.ANY")
	if ev:
		print "name:", ev.output()
		print "raw form:", ev.output(use_raw=True)
		print "description:, ev.desc
To retrieve data for other CPUs set the EVENTMAP environment variable
to the csv file of the CPU before calling find_emap()
changing MSRs and PCI config space
The msr.py, pci.py, latego.py can be used as standalone programs
or python modules to change MSRs, PCI config space or enable/disable
the workarounds.
For example to set the MSR 0x123 on all CPUs to value 1 use:
$ sudo ./msr.py 0x123 1
To read MSR 0x123 on CPU 0
$ sudo ./msr.py 0x123
To read MSR 0x123 on CPU 3:
$ sudo python
>>> import msr
>>> msr.readmsr(0x123, 3)
To set bit 0 in MSR 0x123 on all CPUs:
$ sudo python
>>> import msr
>>> msr.writemsr(0x123, msr.readmsr(0x123), 1)
(this assumes the MSR has the same value on all CPUs, otherwise iterate the readmsr
over the CPUs)
toplev.py:
Identify the micro-architectural bottleneck of a workload.
The bottlenecks are expressed as a tree with different levels (max 5).
Each bottleneck is only meaningful if the parent higher level crossed the
threshold (it acts similar to a binary search). The tool automatically only
prints meaningful ratios, unless -v is specified.
This follows the "Top Down" methodology. The best description of the method
is in the "A top-down method for performance analysis and counter architecture"
paper (ISPASS 2014, available here)
I didn't invent it, I'm just implementing it.
A more gentle introduction is in andi's blog
Please also see the manual and tutorial
toplev.py only supports counting, that is it cannot tell you where in
the program the problem occurred, just what happened. There is now
an experimental --show-sample option to suggest sampling events for specific
problems. The new --run-sample option can also automatically sample
the program by re-running.
Requires Intel CPUs Sandy Bridge (Core 2nd gen, Xeon 5xxx) or newer or Atom Silvermont or newer.
Quark or Xeon Phi are not supported.
By default the simple high level model is used. The detailed model is selected
with -lX, with X being the level.
On non-SMT systems only the program is measured by default, while
with SMT on the whole system is measured.
Examples:
toplev.py -l2 program
measure whole system in level 2 while program is running
toplev.py -l1 --single-thread program
measure single threaded program. system must be idle.
toplev.py -l3 --no-desc -I 100 -x, sleep X
measure whole system for X seconds every 100ms, outputting in CSV format.
toplev.py --all --core C0 taskset -c 0,1 program
Measure program running on core 0 with all nodes and metrics enables
Options:
-h, --help            show this help message and exit
--verbose, -v         Print all results even when below threshold or
                      exceeding boundaries. Note this can result in bogus
                      values, as the TopDown methodology relies on
                      thresholds to correctly characterize workloads.
--kernel              Only measure kernel code
--user                Only measure user code
--print-group, -g     Print event group assignments
--no-desc             Do not print event descriptions
--csv CSV, -x CSV     Enable CSV mode with specified delimeter
--interval INTERVAL, -I INTERVAL
                      Enable interval mode with ms interval
--output OUTPUT, -o OUTPUT
                      Set output file
--graph               Automatically graph interval output with tl-barplot.py
--graph-cpu GRAPH_CPU
                      CPU to graph using --graph
--title TITLE         Set title of graph
--xkcd                Use xkcd plotting mode for graph
--level LEVEL, -l LEVEL
                      Measure upto level N (max 5)
--metrics, -m         Print extra metrics
--raw                 Print raw values
--sw                  Measure perf Linux metrics
--no-util             Do not measure CPU utilization
--tsx                 Measure TSX metrics
--all                 Measure everything available
--frequency           Measure frequency
--no-group            Dont use groups
--no-multiplex        Do not multiplex, but run the workload multiple times
                      as needed. Requires reproducible workloads.
--show-sample         Show command line to rerun workload with sampling
--run-sample          Automatically rerun workload with sampling
--valcsv VALCSV, -V VALCSV
                      Write raw counter values into CSV file
--stats               Show statistics on what events counted
--power               Display power metrics
--core CORE           Limit output to cores. Comma list of Sx-Cx-Tx. All
                      parts optional.
--single-thread, -S   Measure workload as single thread. Workload must run
                      single threaded. In SMT mode other thread must be
                      idle.
--long-desc           Print long descriptions instead of abbreviated ones.
--force-events        Assume kernel supports all events. May give wrong
                      results.
--columns             Print CPU output in multiple columns
--nodes NODES         Include or exclude nodes (with + to add, ^ to remove,
                      comma separated list, wildcards allowed)
--quiet               Avoid unnecessary status output
--bottleneck          Show critical bottleneck
Other perf arguments allowed (see the perf documentation)
After -- perf arguments conflicting with toplev can be used.
Some caveats:
toplev defaults to measuring the full system and show data
for all CPUs. Use taskset to limit the workload to known CPUs if needed.
In some cases (idle system, single threaded workload) --single-thread
can also be used.
The lower levels of the measurement tree are less reliable
than the higher levels. They also rely on counter multi-plexing,
and can not run each equation in a single group, which can cause larger
measurement errors with non steady state workloads
(If you don't understand this terminology; it means measurements
in higher levels are less accurate and it works best with programs that primarily
do the same thing over and over)
If the program is very reproducible -- such as a simple kernel --
it is also possible to use --no-multiplex. In this case the
workload is rerun multiple times until all data is collected.
Do not use together with sleep.
toplev needs a new enough perf tool and has specific requirements on
the kernel. See http://github.com/andikleen/pmu-tools/wiki/toplev-kernel-support
Other CPUs can be forced with FORCECPU=name
This usually requires setting the correct event map with EVENTMAP=...
ucevent uncore monitoring
Please see the ucevent documentation
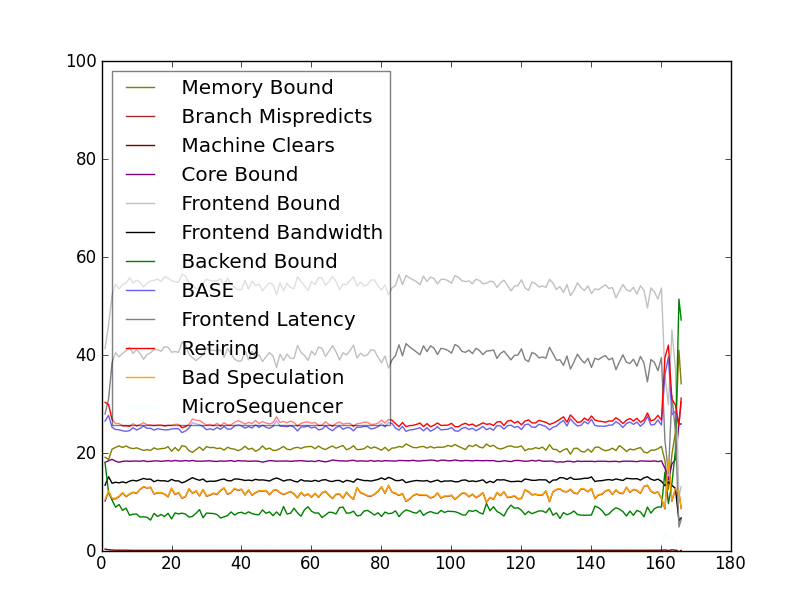
interval-plot:
interval-plot.py can plot the output of perf stat -I1000 -x
Requires matplotlib to be installed.
Below is the level 2 toplev measurement of a Linux kernel compile.
Note that tl-barplot below is normally better to plot toplev output.
interval-normalize:
This converts the output of perf stat -Ixxx -x, / toplev.py -Ixxx -x,
to a normalized output (one column for each event). This allows
easier plotting and processing with other tools (spreadsheets, R, JMP,
gnuplot etc.)
plot-normalized:
Plot an already normalized data file. Requires pyplot to be installed.
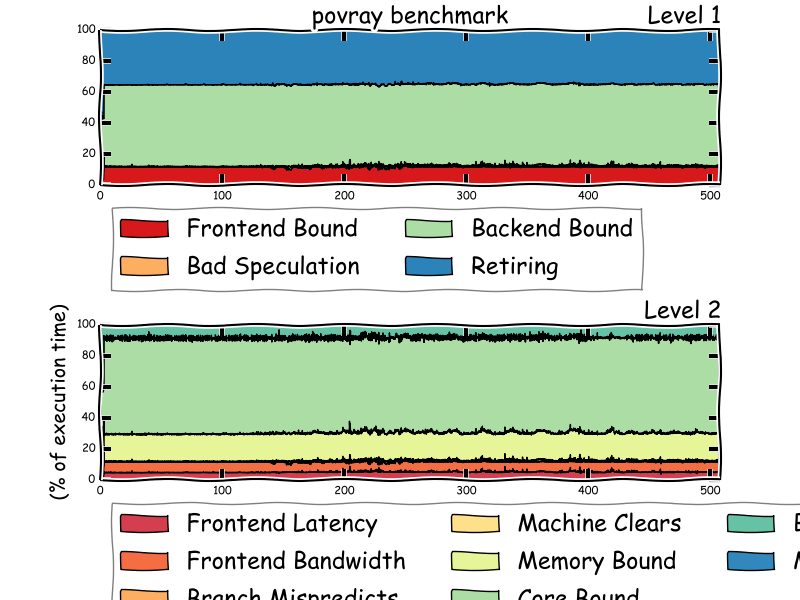
tl-barplot:
Plot output from toplev.py -I 1000 -v -x, --output file.csv -lLEVELS
toplev outputs percentages, so it's better to use a stacked plot,
instead of the absolute values interval-plot displays. tl-barplot
implements a stacked barplot plot.
Requires matplotlib to be installed.
toplev.py --single-thread -l3 --title "GNU grep" --graph grep -r foo /usr/*

This assumes the workload is single threaded. tl-barplot can only
display a single CPU, if --single-thread is not appropriate then
the CPU to plot needs to be specified with --graph-cpu.
With a new enough matplotlib you can also enable xkcd mode
(install Humor Sans first)
tl-serve:
Display toplev.py output in a web browser.
Download dygraphs. Only needs to be done once.
wget http://dygraphs.com/1.0.1/dygraph-combined.js
Run toplev:
toplev.py --all -I 100 -o x.csv ...
tl-serve.py x.csv
Then browse http://localhost:9001/ in your web browser.
cputop
query cpu topology and print all matching cpu numbers
cputop "query" ["format"]
query is a python expression, using variables: socket, core, thread or "offline" to query all offline cpus
format is a printf format with %d. %d will be replaced with the cpu number.
format can be offline to offline the cpu or online to online
Examples:
Print all cores on socket 0
cputop "socket == 0"
Print all first threads in each core on socket 0
cputop "thread == 0 and socket == 0"
Disable all second threads (disable hyper threading)
cputop "thread == 1" offline
Reenable all second threads (reenable hyper threading)
cputop "thread == 0" online
pebs-grabber:
Older perf doesn't export the raw PEBS output, which contains a lot of useful
information. PEBS is a sampling format generated by Intel CPUs for
some events.
pebs-grabber grabs PEBS data from perf. This assumes the perf pebs
handler is running, we just also do trace points with the raw data.
May need some minor tweaks as kernel interface change, and will also
not likely work on very old kernels.
This will create two new trace points trace_pebs_v1 and trace_pebs_v2
that log the complete PEBS record. When the CPU supports PEBSv2
(Haswell) the additional fields will be logged in pebs_v2.
  make [KDIR=/my/kernel/build/dir]
  insmod pebs-grabber.ko
  # needs to record as root
  perf record -e cycles:p,pebs_v1,pebs\_v2 [command, -a for all etc.]
  perf report
  perf script to display pebs data
  # alternatively trace-cmd and kernelshark can be also used to dump
  # the pebs data
See http://download.intel.com/products/processor/manual/253669.pdf
18.10.2 for a description of the PEBS fields.
Note this doesn't work with standard FC18 kernels, as they broke
trace points in modules. It works with later and earlier kernels.
event-rmap
event-rmap [cpu] prints the currently running events. This provides
an easier answer to question Q2j in Vince Weaver's perf events FAQ.
Testing
The all-tester script runs all test suites.
Mailing list
Please post to the linux-perf-users@vger.kernel.org mailing list.
For bugs please open an issue on https://github.com/andikleen/pmu-tools/issues
Licenses
ocperf, toplev, ucevent, parser are under GPLv2, jevents is under the modified BSD license.
Andi Kleen
pmu-tools@halobates.de