neo4jd3.js
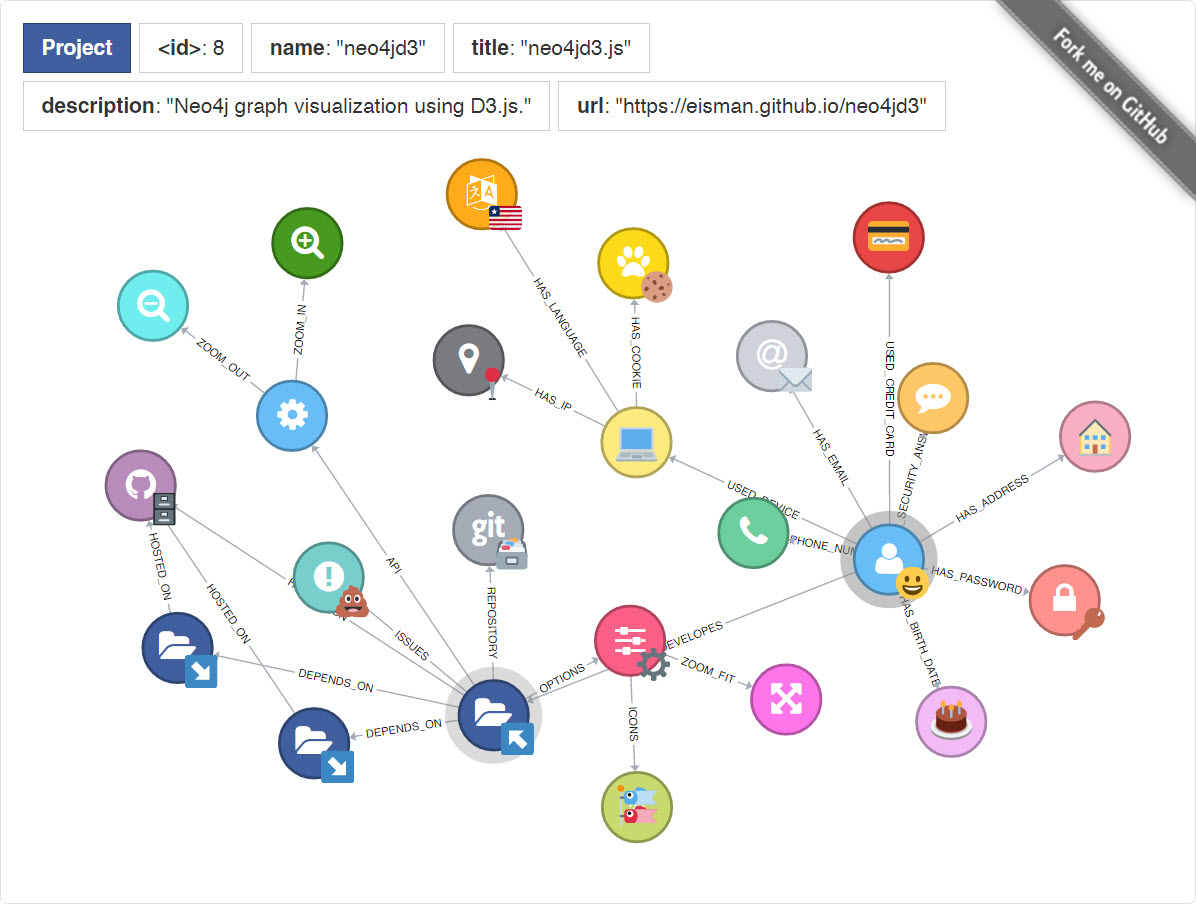
Neo4j graph visualization using D3.js.
Features
- Compaptible with the Neo4j data format and the D3.js data format.
- Force simulation.
- Info panel that shows nodes and relationships information on hover.
- Double click callbacks.
- Custom node colors by node type.
- Text nodes + Font Awesome icon nodes + SVG image nodes (e.g. using Twitter Emoji)).
- Sticky nodes (drag to stick, single click to unstick).
- Dynamic graph update (e.g. double click a node to expand it).
- Highlight nodes on init.
- Relationship auto-orientation.
- Zoom, pan, auto fit.
- Compatible with D3.js v4.
Running
First of all, make sure you have ruby and sass gem installed. Then, clone the repository, install all dependencies, build and serve the project.
> gem install sass
> git clone https://github.com/eisman/neo4jd3.git
> npm install
> gulp
Open http://localhost:8080 in your favorite browser.
Documentation
var neo4jd3 = new Neo4jd3('.selector', options);
Options, Parameter, Type, Description, ---------, ----, -----------, highlight, array, Highlight several nodes of the graph.Example:[ { class: 'Project', property: 'name', value: 'neo4jd3' }], icons, object, Map node labels to Font Awesome icons.Example:{ 'BirthDate': 'birthday-cake', 'Password': 'lock', 'Phone': 'phone', 'User': 'user'}., images, object, Map node labels to SVG images (e.g. using Twitter Emoji).Example:{ 'Address': 'img/twemoji/1f3e0.svg', 'BirthDate': 'img/twemoji/1f382.svg', 'Password': 'img/twemoji/1f511.svg', 'Project': 'img/twemoji/2198.svg', 'Project\, name\, neo4jd3': 'img/twemoji/2196.svg', 'User': 'img/twemoji/1f600.svg'}., infoPanel, boolean, Show the information panel: true, false. Default: true., minCollision, int, Minimum distance between nodes. Default: 2 * nodeRadius., neo4jData, object, Graph data in Neo4j data format., neo4jDataUrl, string, URL of the endpoint that serves the graph data in Neo4j data format., nodeRadius, int, Radius of nodes. Default: 25., onNodeClick, function, Callback function to be executed when the user clicks a node., onNodeDoubleClick, function, Callback function to be executed when the user double clicks a node., onNodeDragEnd, function, Callback function to be executed when the user finishes dragging a node., onNodeDragStart, function, Callback function to be executed when the user starts dragging a node., onNodeMouseEnter, function, Callback function to be executed when the mouse enters a node., onNodeMouseLeave, function, Callback function to be executed when the mouse leaves a node., onRelationshipDoubleClick, function, Callback function to be executed when the user double clicks a relationship., zoomFit, boolean, Adjust the graph to the container once it has been loaded: true, false. Default: false., ### JavaScript API, Function, Description, --------, -----------, appendRandomDataToNode(d, maxNodesToGenerate), Generates between 1 and maxNodesToGenerate random nodes connected to node d and updates the graph data., neo4jDataToD3Data(data), Converts data from Neo4j data format to D3.js data format., randomD3Data(d, maxNodesToGenerate), Generates between 1 and maxNodesToGenerate random nodes connected to node d., size(), Returns the number of nodes and relationships.Example:{ nodes: 25, relationships: 50}, updateWithD3Data(d3Data), Updates the graph data using the D3.js data format., updateWithNeo4jData(neo4jData), Updates the graph data using the Neo4j data format., version(), Returns the version of neo4jd3.js.Example: '0.0.1', ### Documentation
D3.js data format
{
    "nodes": [
        {
            "id": "1",
            "labels": ["User"],
            "properties": {
                "userId": "eisman"
            }
        },
        {
            "id": "8",
            "labels": ["Project"],
            "properties": {
                "name": "neo4jd3",
                "title": "neo4jd3.js",
                "description": "Neo4j graph visualization using D3.js.",
                "url": "https://eisman.github.io/neo4jd3"
            }
        }
    ],
    "relationships": [
        {
            "id": "7",
            "type": "DEVELOPES",
            "startNode": "1",
            "endNode": "8",
            "properties": {
                "from": 1470002400000
            },
            "source": "1",
            "target": "8",
            "linknum": 1
        }
    ]
}
Neo4j data format
{
    "results": [
        {
            "columns": ["user", "entity"],
            "data": [
                {
                    "graph": {
                        "nodes": [
                            {
                                "id": "1",
                                "labels": ["User"],
                                "properties": {
                                    "userId": "eisman"
                                }
                            },
                            {
                                "id": "8",
                                "labels": ["Project"],
                                "properties": {
                                    "name": "neo4jd3",
                                    "title": "neo4jd3.js",
                                    "description": "Neo4j graph visualization using D3.js.",
                                    "url": "https://eisman.github.io/neo4jd3"
                                }
                            }
                        ],
                        "relationships": [
                            {
                                "id": "7",
                                "type": "DEVELOPES",
                                "startNode": "1",
                                "endNode": "8",
                                "properties": {
                                    "from": 1470002400000
                                }
                            }
                        ]
                    }
                }
            ]
        }
    ],
    "errors": []
}
Example
Live example @ https://eisman.github.io/neo4jd3/
var neo4jd3 = new Neo4jd3('#neo4jd3', {
    highlight: [
        {
            class: 'Project',
            property: 'name',
            value: 'neo4jd3'
        }, {
            class: 'User',
            property: 'userId',
            value: 'eisman'
        }
    ],
    icons: {
        'Api': 'gear',
        'BirthDate': 'birthday-cake',
        'Cookie': 'paw',
        'Email': 'at',
        'Git': 'git',
        'Github': 'github',
        'Ip': 'map-marker',
        'Issues': 'exclamation-circle',
        'Language': 'language',
        'Options': 'sliders',
        'Password': 'asterisk',
        'Phone': 'phone',
        'Project': 'folder-open',
        'SecurityChallengeAnswer': 'commenting',
        'User': 'user',
        'zoomFit': 'arrows-alt',
        'zoomIn': 'search-plus',
        'zoomOut': 'search-minus'
    },
    images: {
        'Address': 'img/twemoji/1f3e0.svg',
        'BirthDate': 'img/twemoji/1f5d3.svg',
        'Cookie': 'img/twemoji/1f36a.svg',
        'CreditCard': 'img/twemoji/1f4b3.svg',
        'Device': 'img/twemoji/1f4bb.svg',
        'Email': 'img/twemoji/2709.svg',
        'Git': 'img/twemoji/1f5c3.svg',
        'Github': 'img/twemoji/1f5c4.svg',
        'icons': 'img/twemoji/1f38f.svg',
        'Ip': 'img/twemoji/1f4cd.svg',
        'Issues': 'img/twemoji/1f4a9.svg',
        'Language': 'img/twemoji/1f1f1-1f1f7.svg',
        'Options': 'img/twemoji/2699.svg',
        'Password': 'img/twemoji/1f511.svg',
        'Project, name, d3': 'img/twemoji/32-20e3.svg',
        'Project, name, neo4j': 'img/twemoji/33-20e3.svg',
        'Project, name, neo4jd3': 'img/twemoji/31-20e3.svg',
        'User': 'img/twemoji/1f600.svg'
    },
    minCollision: 60,
    neo4jDataUrl: 'json/neo4jData.json',
    nodeRadius: 25,
    onNodeDoubleClick: function(node) {
        switch(node.id) {
            case '25':
                // Google
                window.open(node.properties.url, '_blank');
                break;
            default:
                var maxNodes = 5,
                    data = neo4jd3.randomD3Data(node, maxNodes);
                neo4jd3.updateWithD3Data(data);
                break;
        }
    },
    zoomFit: true
});
What's coming?
- Toolbar.
- More than one relationship between two nodes.
- Markers.
- Performance optimization.
- Testing.
Copyright and license
Code and documentation copyright 2016 the author. Code released under the MIT license. Docs released under Creative Commons.