GDB dashboard
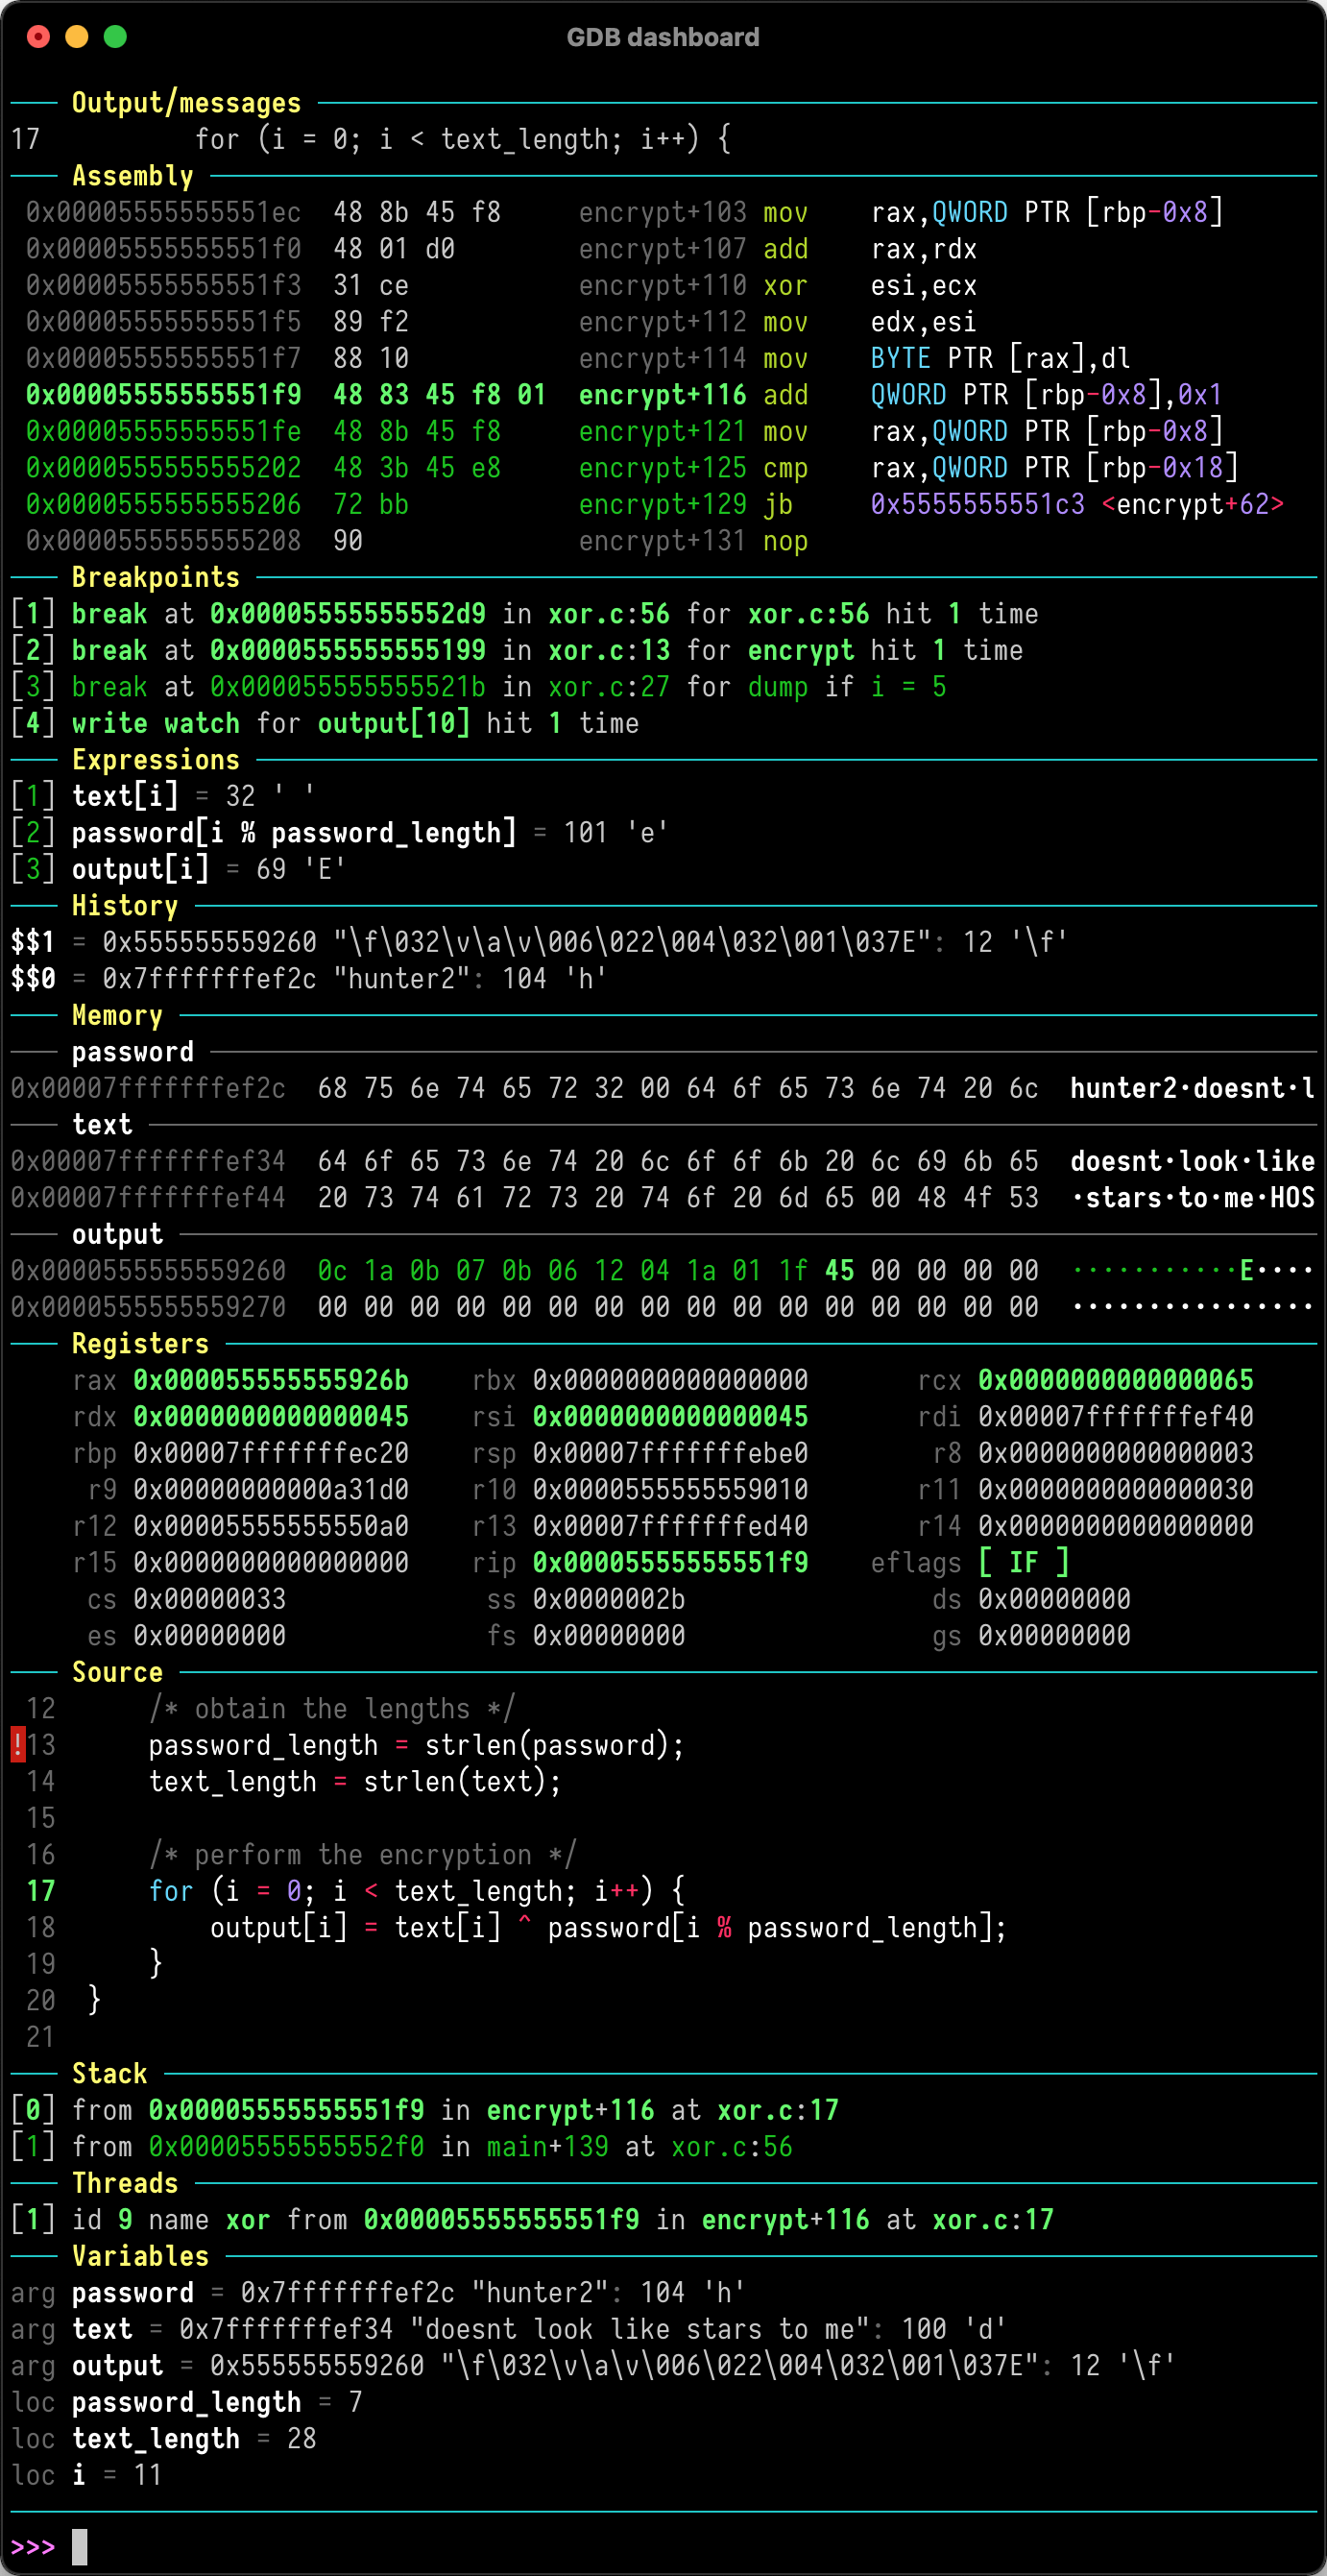
GDB dashboard is a standalone .gdbinit file written using the Python API that enables a modular interface showing relevant information about the program being debugged. Its main goal is to reduce the number of GDB commands needed to inspect the status of current program thus allowing the developer to primarily focus on the control flow.
Quickstart
Just place .gdbinit in your home directory, for example with:
wget -P ~ git.io/.gdbinit
Optionally install [Pygments][] to enable syntax highlighting:
pip install pygments
Then debug as usual, the dashboard will appear automatically when the inferior program stops. Keep in mind that no GDB command has been redefined, instead all the features are available via the main dashboard command (see help dashboard).
The wiki also can be useful as it contains some common use cases.
Requirements
GDB dashboard requires at least GDB 7.7 compiled with Python 2.7 in order to work properly, see #1 for more details and possible workarounds. To find the Python version used by GDB run:
gdb --batch -ex 'python import sys; print(sys.version)'
Make sure that the system locale is configured to use UTF-8, in most cases it already is, otherwise (in case of UnicodeEncodeError errors) a simple solution is to export the following environment variable:
export LC_CTYPE=C.UTF-8
On Windows the windows-curses Python package is needed in order to obtain the correct terminal size.
GDB dashboard is not meant to work seamlessly with additional front ends, e.g., TUI, Nemiver, QtCreator, etc. either instruct the front end to not load the .gdbinit file or load the dashboard manually.
Default modules
Follows the list of bundled default modules, refer to the GDB help system for the full syntax.
assembly shows the disassembled code surrounding the program counter. The instructions constituting the current statement are marked, if available.
history lists the last entries of the GDB value history.
memory allows to inspect memory regions.
registers shows the CPU registers and their values.
source show the program source code, if available.
stack shows the current stack trace including the function name and the file location, if available. Optionally lists the frame arguments and locals too.
threads lists the currently available threads.
variables shows arguments and locals of the selected frame.
expressions watches user expressions.
breakpoints displays the breakpoints list.
Commands
The GDB documentation is available at help dashboard. Just like any GDB command, abbreviations are possible, so da, dash, etc. all resolve to dashboard.
dashboard
This is the root command and it is used to manually redisplay the dashboard.
dashboard -configuration [<file>]
Display and optionally write to <file> the current configuration (layout, styles, outputs). This command allows to configure the dashboard live then make the changes permanent, for example:
dashboard -configuration ~/.gdbinit.d/auto
dashboard -output [<file>]
By default the dashboard is displayed in the GDB terminal together with the prompt and the program I/O but it may be convenient to display the whole dashboard or individual modules to other terminals.
This command allows to specify the destination terminal for both the dashboard and the modules, in such a way that when the output of a module is not specified then the dashboard output is used. To restore the original value run the command omitting the file.
To identify the TTY file name associated with terminal use the tty system command, those entries are often in the format /dev/pts/<n>.
The dashboard -layout command can be used to display a summary of the active modules and their outputs.
If <file> is not a valid terminal then the size of the GDB terminal is used to render the modules.
dashboard -enabled [on