Facette 
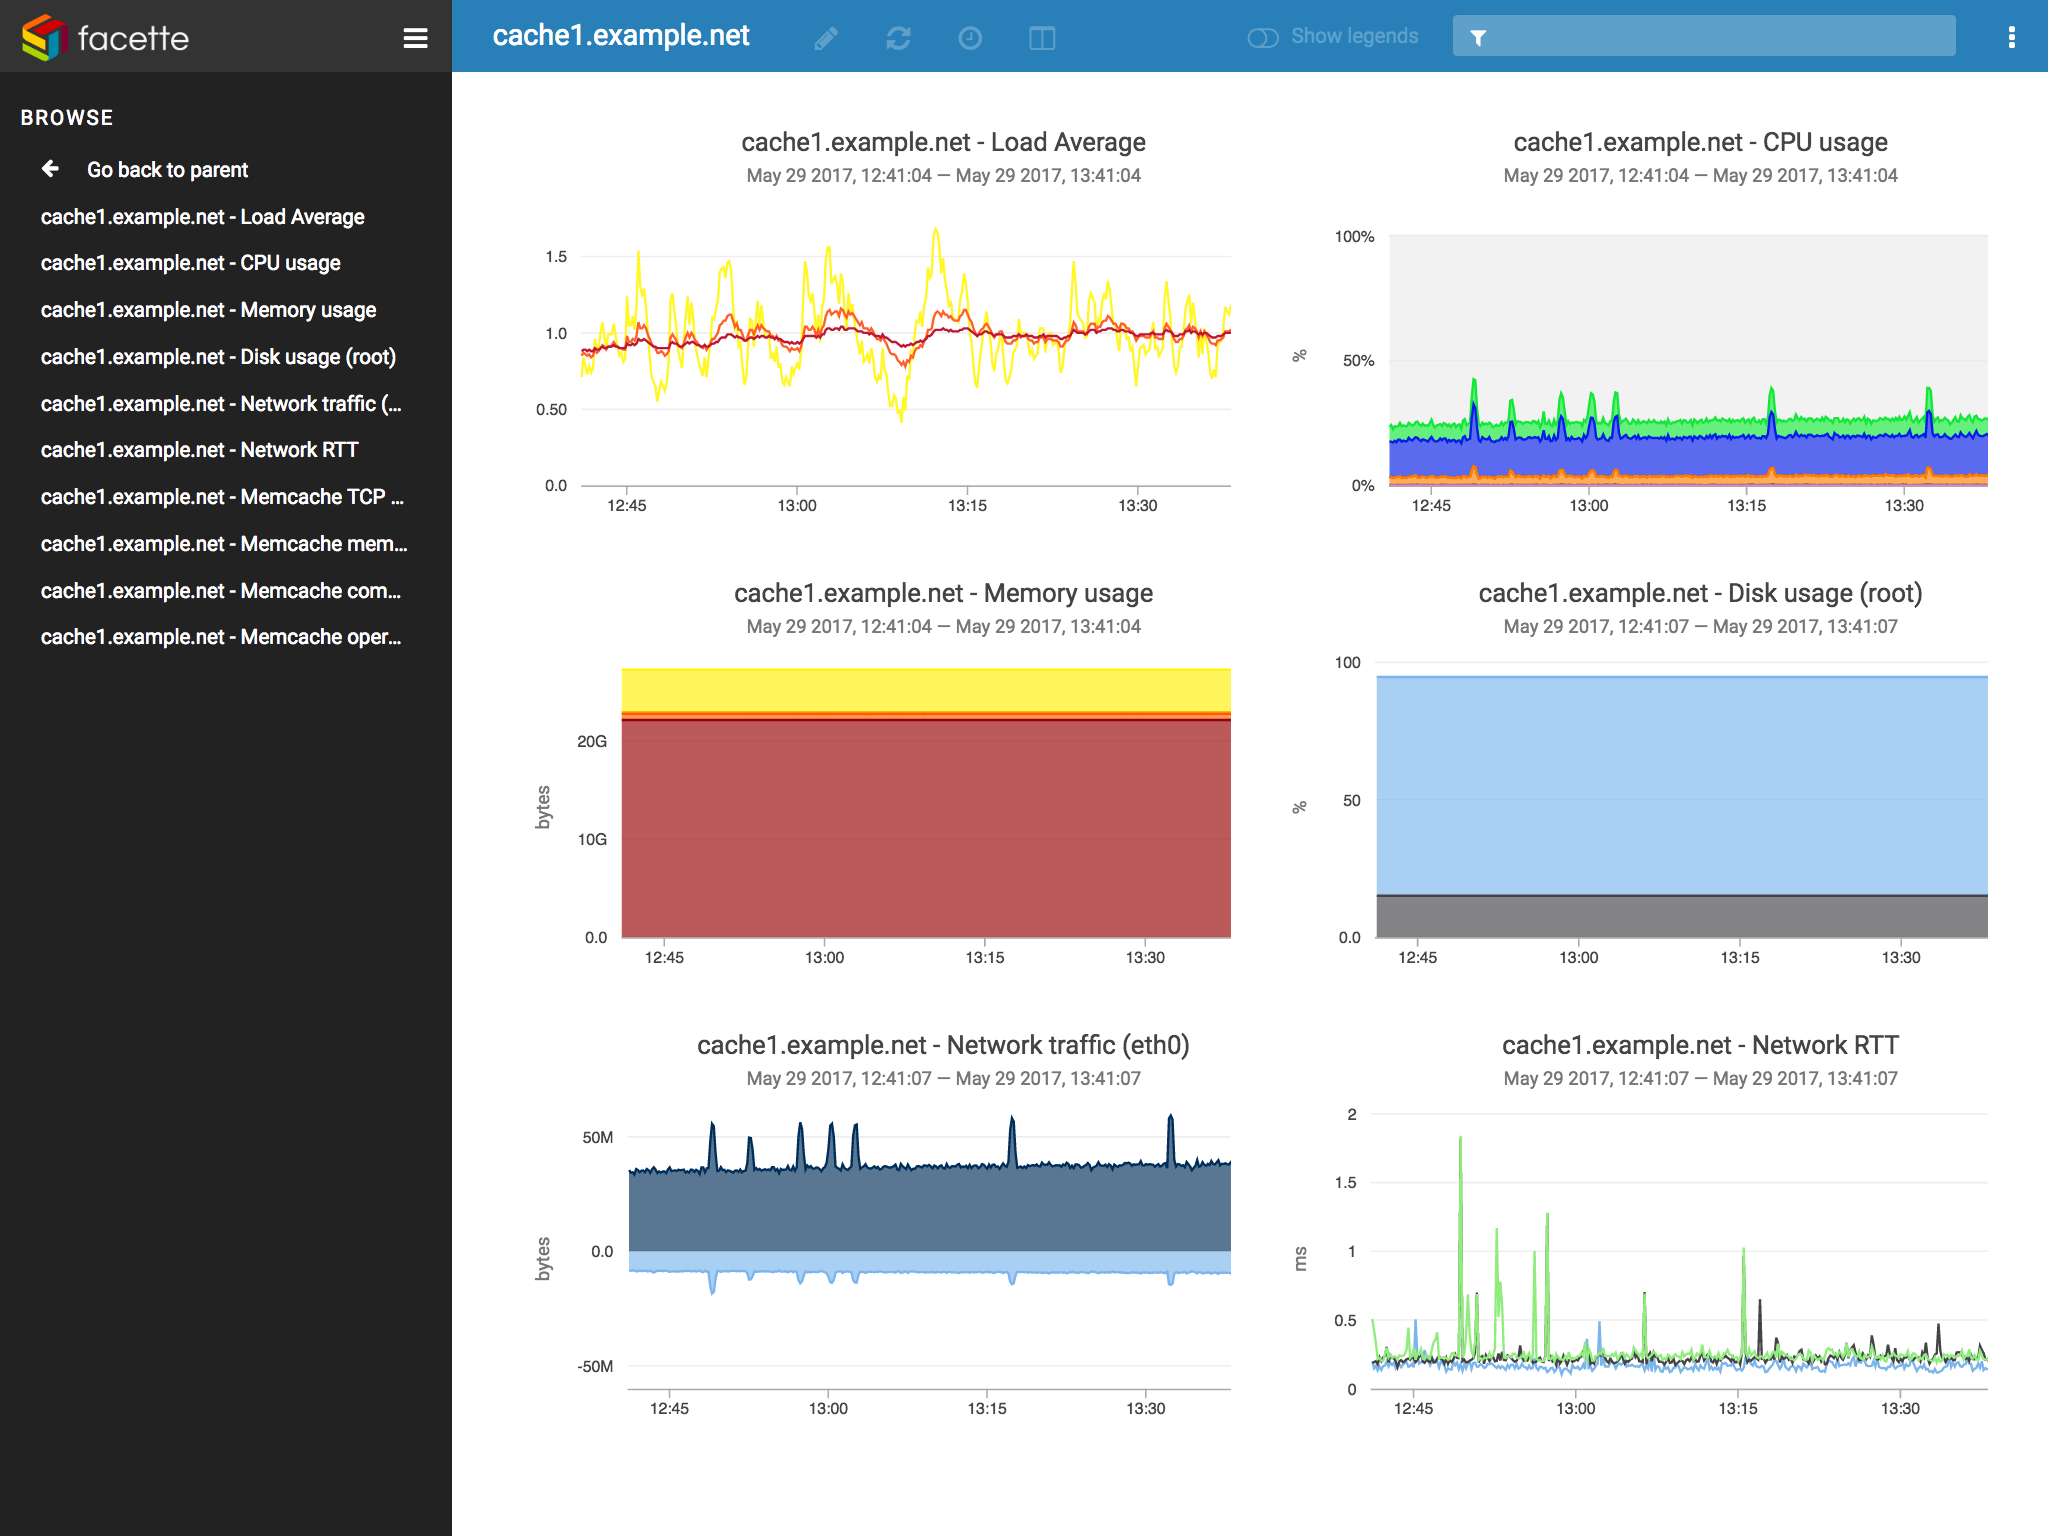
Facette is a open source web application to display time
series data from various sources — such as collectd,
Graphite, InfluxDB or
KairosDB — on graphs. To learn more on its architecture,
read this page.
The source code is available at Github and is licensed
under the terms of the BSD license.
Installation
Please see INSTALL.md file for build instructions and
installation procedures.
Contribution
We welcome all your contributions. So, don't hesitate to fork the project,
make your changes and submit us your pull requests.
However, as Facette is under development and still subject to heavy changes,
please open an issue to discuss yours if you think that they will have quite
an impact on the code base before starting contributing.
To make the things easier, we will ask for the following:
- Always use
gofmt - Keep code lines length under 120 characters
- Provide (when applicable) unit tests for the new code
- Make sure to run
make test, having the process completing successfully - Squash your commits into a single commit