Algorithm Visualizer
Algorithm Visualizer is an interactive online platform that visualizes algorithms from code.


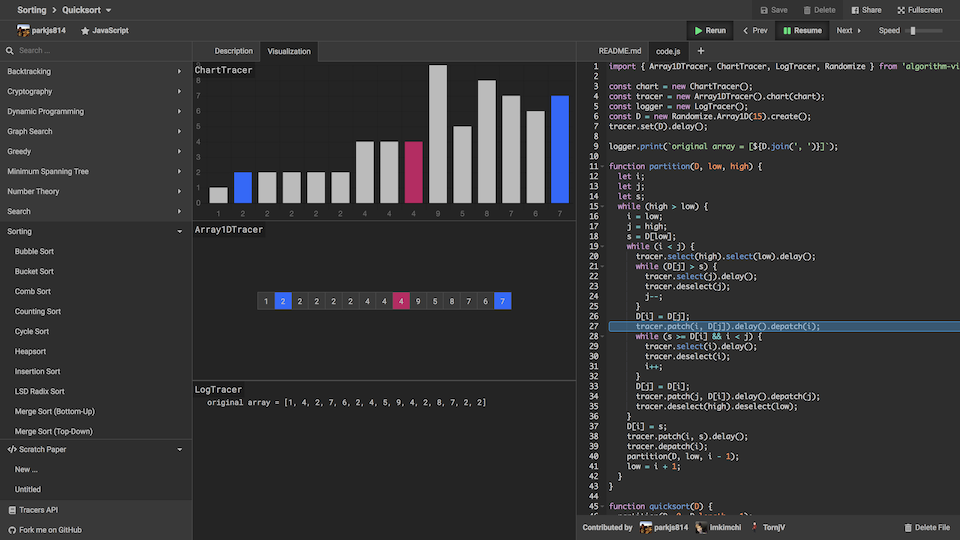
Learning an algorithm gets much easier with visualizing it. Don't get what we mean? Check it out:
Contributing
We have multiple repositories under the hood that comprise the website. Take a look at the contributing guidelines in the repository you want to contribute to.
-
algorithm-visualizeris a web app written in React. It contains UI components and interprets commands into visualizations. Check out the contributing guidelines. -
serverserves the web app and provides APIs that it needs on the fly. (e.g., GitHub sign in, compiling/running code, etc.) -
algorithmscontains visualizations of algorithms shown on the side menu of the website. -
tracers.*are visualization libraries written in each supported language. They extract visualizing commands from code.